cPanel Metrics for your Website
cPanel Metrics
Understanding Your Website Activity.
The Metrics section in cPanel helps you see what’s happening behind the scenes on your website. It gives you a snapshot of things like visitor activity, data usage, and errors your site may be returning.
You don’t need to be a server expert to make sense of Metrics, but it’s most useful if you’re comfortable looking at basic website data. It’s designed to help you understand what’s going on—not to fix problems directly.
What are Metrics used for?
Metrics shows you how people and systems interact with your website. You can use it to:
- See when your site is busy or quiet
- Spot repeated errors, like missing pages
- Keep an eye on how much data your site is using
- Check whether your site is getting close to its hosting limits
If you’re trying to troubleshoot a website issue, Metrics can help point you in the right direction. However, changes or fixes usually need to be made elsewhere (for example, in your website’s files or settings).
1. How to access Metrics
Log in to cPanel, If you need help signing in, see our guide here.
- Scroll to the Metrics section, or use the search bar at the top of the page.
- Select the report you want to view, such as Visitors, Bandwidth, or Errors.
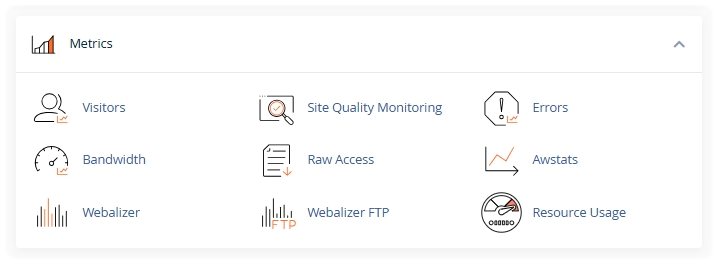
2. What you’ll find in the Metrics section
Each tool in Metrics shows a different part of your website’s activity:
Visitors:
Shows recent visits to your site, including:
- Visitor IP addresses
- Pages they viewed
- The date and time of each visit
This is useful for getting a quick overview of who’s accessing your site and what they’re looking at.
Errors:
Lists recent issues your site has returned, such as 404 (Page Not Found) errors.
This can help you spot broken links or missing pages.
Bandwidth:
Shows how much data your website has sent and received over time.
This is helpful for:
- Tracking usage
- Understanding traffic spikes
- Making sure you stay within your hosting allowance
Raw Access:
Provides downloadable log files containing all requests made to your website.
These are more detailed and are usually used by developers or advanced users for deeper analysis.
Resource Usage:
Shows how much of your hosting resources, like CPU and memory, your site is using.
It also highlights if your site has reached or exceeded any limits.
Awstats:
Displays visual reports on website traffic, including:
- Visitor locations
- Browsers and devices used
- Traffic trends over time
Webalizer:
Another traffic summary tool, offering simple graphs and high‑level statistics
3. A quick note on Metrics
Metrics gives you access to raw website data and basic reports, but it isn’t a full analytics platform. If you need more detailed insights, such as user behaviour or conversion tracking, you may want to explore third‑party tools outside of cPanel.
Zen doesn’t monitor or manage customer websites, so we’re not able to recommend specific external services.
For more detailed technical information about each metric, you can visit the official cPanel Documentation.
Need Help?
Feel free to contact our Web Hosting team.